When it comes to safety-critical applications at sea, such as lifelines, mooring strops or towing lines, knowing the true strength of your spliced Dyneema may be critical. Manufacturers typically publish their own data, which provides a good benchmark. Break testing our own splices gives a realistic, hands-on assessment of how our professional splicing performs under load.
In this article, we explore how break strength testing is carried out on a spliced 12-strand Dyneema, what the results mean in practical terms, and why it's useful for serious sailors and riggers alike.
What is Break Strength Testing?
Break strength testing is the controlled process of increasing tension on a rope or splice until it physically fails (breaks). The goal is to find the maximum load the line can withstand before failure.
This testing is particularly relevant for spliced Dyneema, where the quality of the splice can significantly affect the overall strength of the line. Even the best materials are only as strong as their weakest point. In most cases, that weak point is the entry point to a splice. To learn more about why a splice is still the strongest solution, please read this article.
Why Test a Splice?
Dyneema is renowned for its exceptional strength-to-weight ratio, low stretch and long-term durability. However, once it is spliced, those properties are influenced by:
- The type of splice used (e.g. locking Brummel, centre eye, adjustable, loop)
- The execution of the splice – accuracy, taper, and consistency
- The diameter and grade of the Dyneema used (e.g. SK75, SK78, DM20)
- The load path and whether it is direct or affected by bends or friction
Testing a finished splice verifies that the ropework meets expectations and can provide an accurate working load limit for real-world use.
Step-by-Step Break Test Process:
Here’s how the break-strength testing process typically unfolds.
- Preparation of the Test Sample - A suitable length of 12-strand Dyneema is selected and spliced using a consistent, repeatable method. The splice is created under controlled conditions, ensuring neat bury lengths, smooth tapers, and any locking elements (such as a Brummel) are accurately formed.
- Mounting the Sample - The spliced rope is mounted into a calibrated tensile test bed with purpose-made cleats or pins that avoid introducing sharp bends or stress concentrations. The test rig ensures that force is applied in a straight line to mimic in-use tension.
- Applying Load - The machine begins to apply tension at a constant, controlled rate, recording both the force and the elongation of the line. The load is increased steadily until failure occurs.
- Recording the Failure Point - The breaking load is automatically recorded at the exact moment of failure. The machine also logs the mode of failure—whether the rope snapped, the splice slipped, or there was a combination of the two.
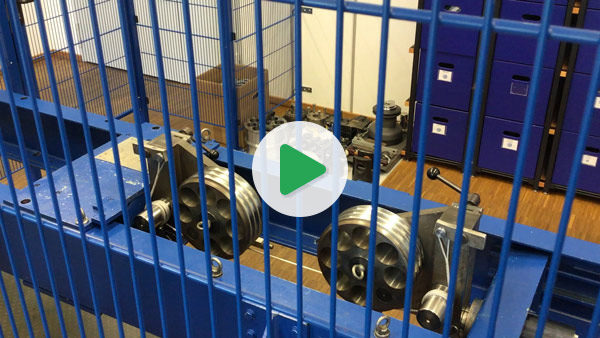
Breaking a LIROS D-Pro Static Soft Eye in a LIROS test bed
What did Jimmy Green Marine Test?
- Standard loop splice structure of 6mm DynIce Dux and Marlow D12 Max 99
- Continuous Loop splice in 6mm LIROS D-Pro and Marlow D12 Max 99
What did we Expect?
A well-executed loop splice in high-grade Dyneema will typically retain at least 80% of the rope’s original strength. Marlow’s Paul Dyer comments, “We don’t normally quote a linear figure as it’s not something we can see in testing, it’s simply a spliced figure divided by 0.9 as the standard for testing (ISO 2307) allows for a 10% reduction in strength if a rope breaks in the splice. Since we don’t have a true unspliced figure this is, at best, an approximation.” Therefore, we would expect to see the break load within 11-12 % of the spliced break load (manufacturers break load divided by 0.9 then multiplied by 0.8).
We would expect the soft loops to be significantly stronger than the manufacturers linear break load. This should be due to the increased volume of material being present between the strong points.
What Were the Test Results?
| Type of Product |
Manufacturer |
Rope Diameter |
Manufacturer Linear Break Load |
Actual Break Load |
Change |
Where did it fail? |
Notes |
| Strop with a soft loop on both ends |
Hampidjan DynIce Dux SK75 |
6mm |
6.1T |
5.4T |
12% decrease |
At the Brummell |
Did the whipping affect the break point? |
| Strop with a soft loop on both ends |
Marlow D12 Max 99 |
6mm |
5.4T |
5.9T |
9% increase |
At the end of the taper, as you would expect |
Understated manufacturer break load |
| Continuous Loop |
Marlow D12 Max 99 |
6mm |
5.4T |
1 Strand @ 7.1T - Broke @ 8.8T |
60% increase |
Where the cores meet |
Review - overlapped bury? |
| Continuous Loop |
LIROS D Pro SK78 |
6mm |
4.3T |
1 strand @ 5.5T - Broke @ 8.4T |
95% increase |
Where the cores meet |
Review - overlapped bury? |
What Did the Results Show?
The DynIce Dux loop broke with a 12% reduction from the anticipated spliced break load. It broke at the Brummel which was not anticipated as most splices break at the bitter end of the bury.
The Marlow D12 Max 99 loop exceeded the average manufacturer break load by 9%. Both splices were completed to the same specification in terms of structure and finish. Both broke within the anticipated range but with significant differences. More tests are required to determine if minor alterations to the whippings and brummel locks at the throat contribute to the variation.
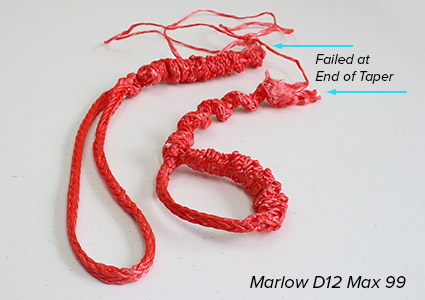
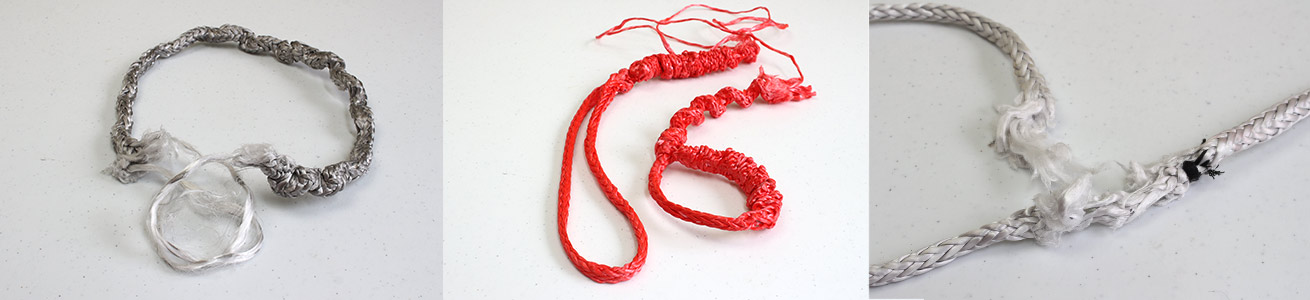
The break test results of a Strop with soft loops on both ends made in Marlow D12 Max 99
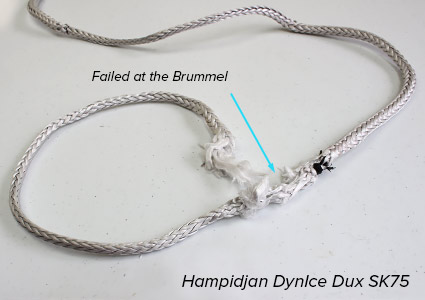
The break test failure of a Strop with soft loops on both ends made in Hampidjan DynIce Dux SK75
Both the continuous loops provided break loads in excess of their linear break loads as predicted. The results may be improved by overlapping the tail ends of the bury by reducing the overall diameter change of the line where they meet.
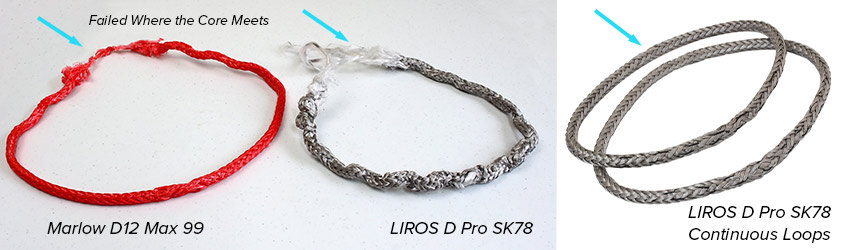
The results of break tests of Continuous Loops in Marlow D12 Max 99 and LIROS D Pro SK78
Marlow’s Paul Dyer concluded, “The ‘rule of thumb’ for a loop is that it’s around 1.6x the strength of the rope from which it’s made. The test result in this case matches that prediction very closely.
Overall the testing has achieved what would be expected, all be it with one of the results at the high (strong) end of what would be considered normal.”
Final Thoughts
Break strength testing is a valuable process for anyone relying on spliced Dyneema in critical marine applications. It not only quantifies the strength of a finished splice but also ensures safety margins are based on real performance, not just manufacturer specs.
At Jimmy Green Marine, we take great care to ensure all our Dyneema splicing is professionally executed to a consistent, repeatable formula. For those who splice their own gear, we recommend gaining a clear understanding of how your technique affects the final strength—and if in doubt, consider testing your own samples.
For more guidance on splicing Dyneema or arranging a custom break test, please contact our team or explore our Knowledge Centre.


 Back
Back